Free printable count and graph
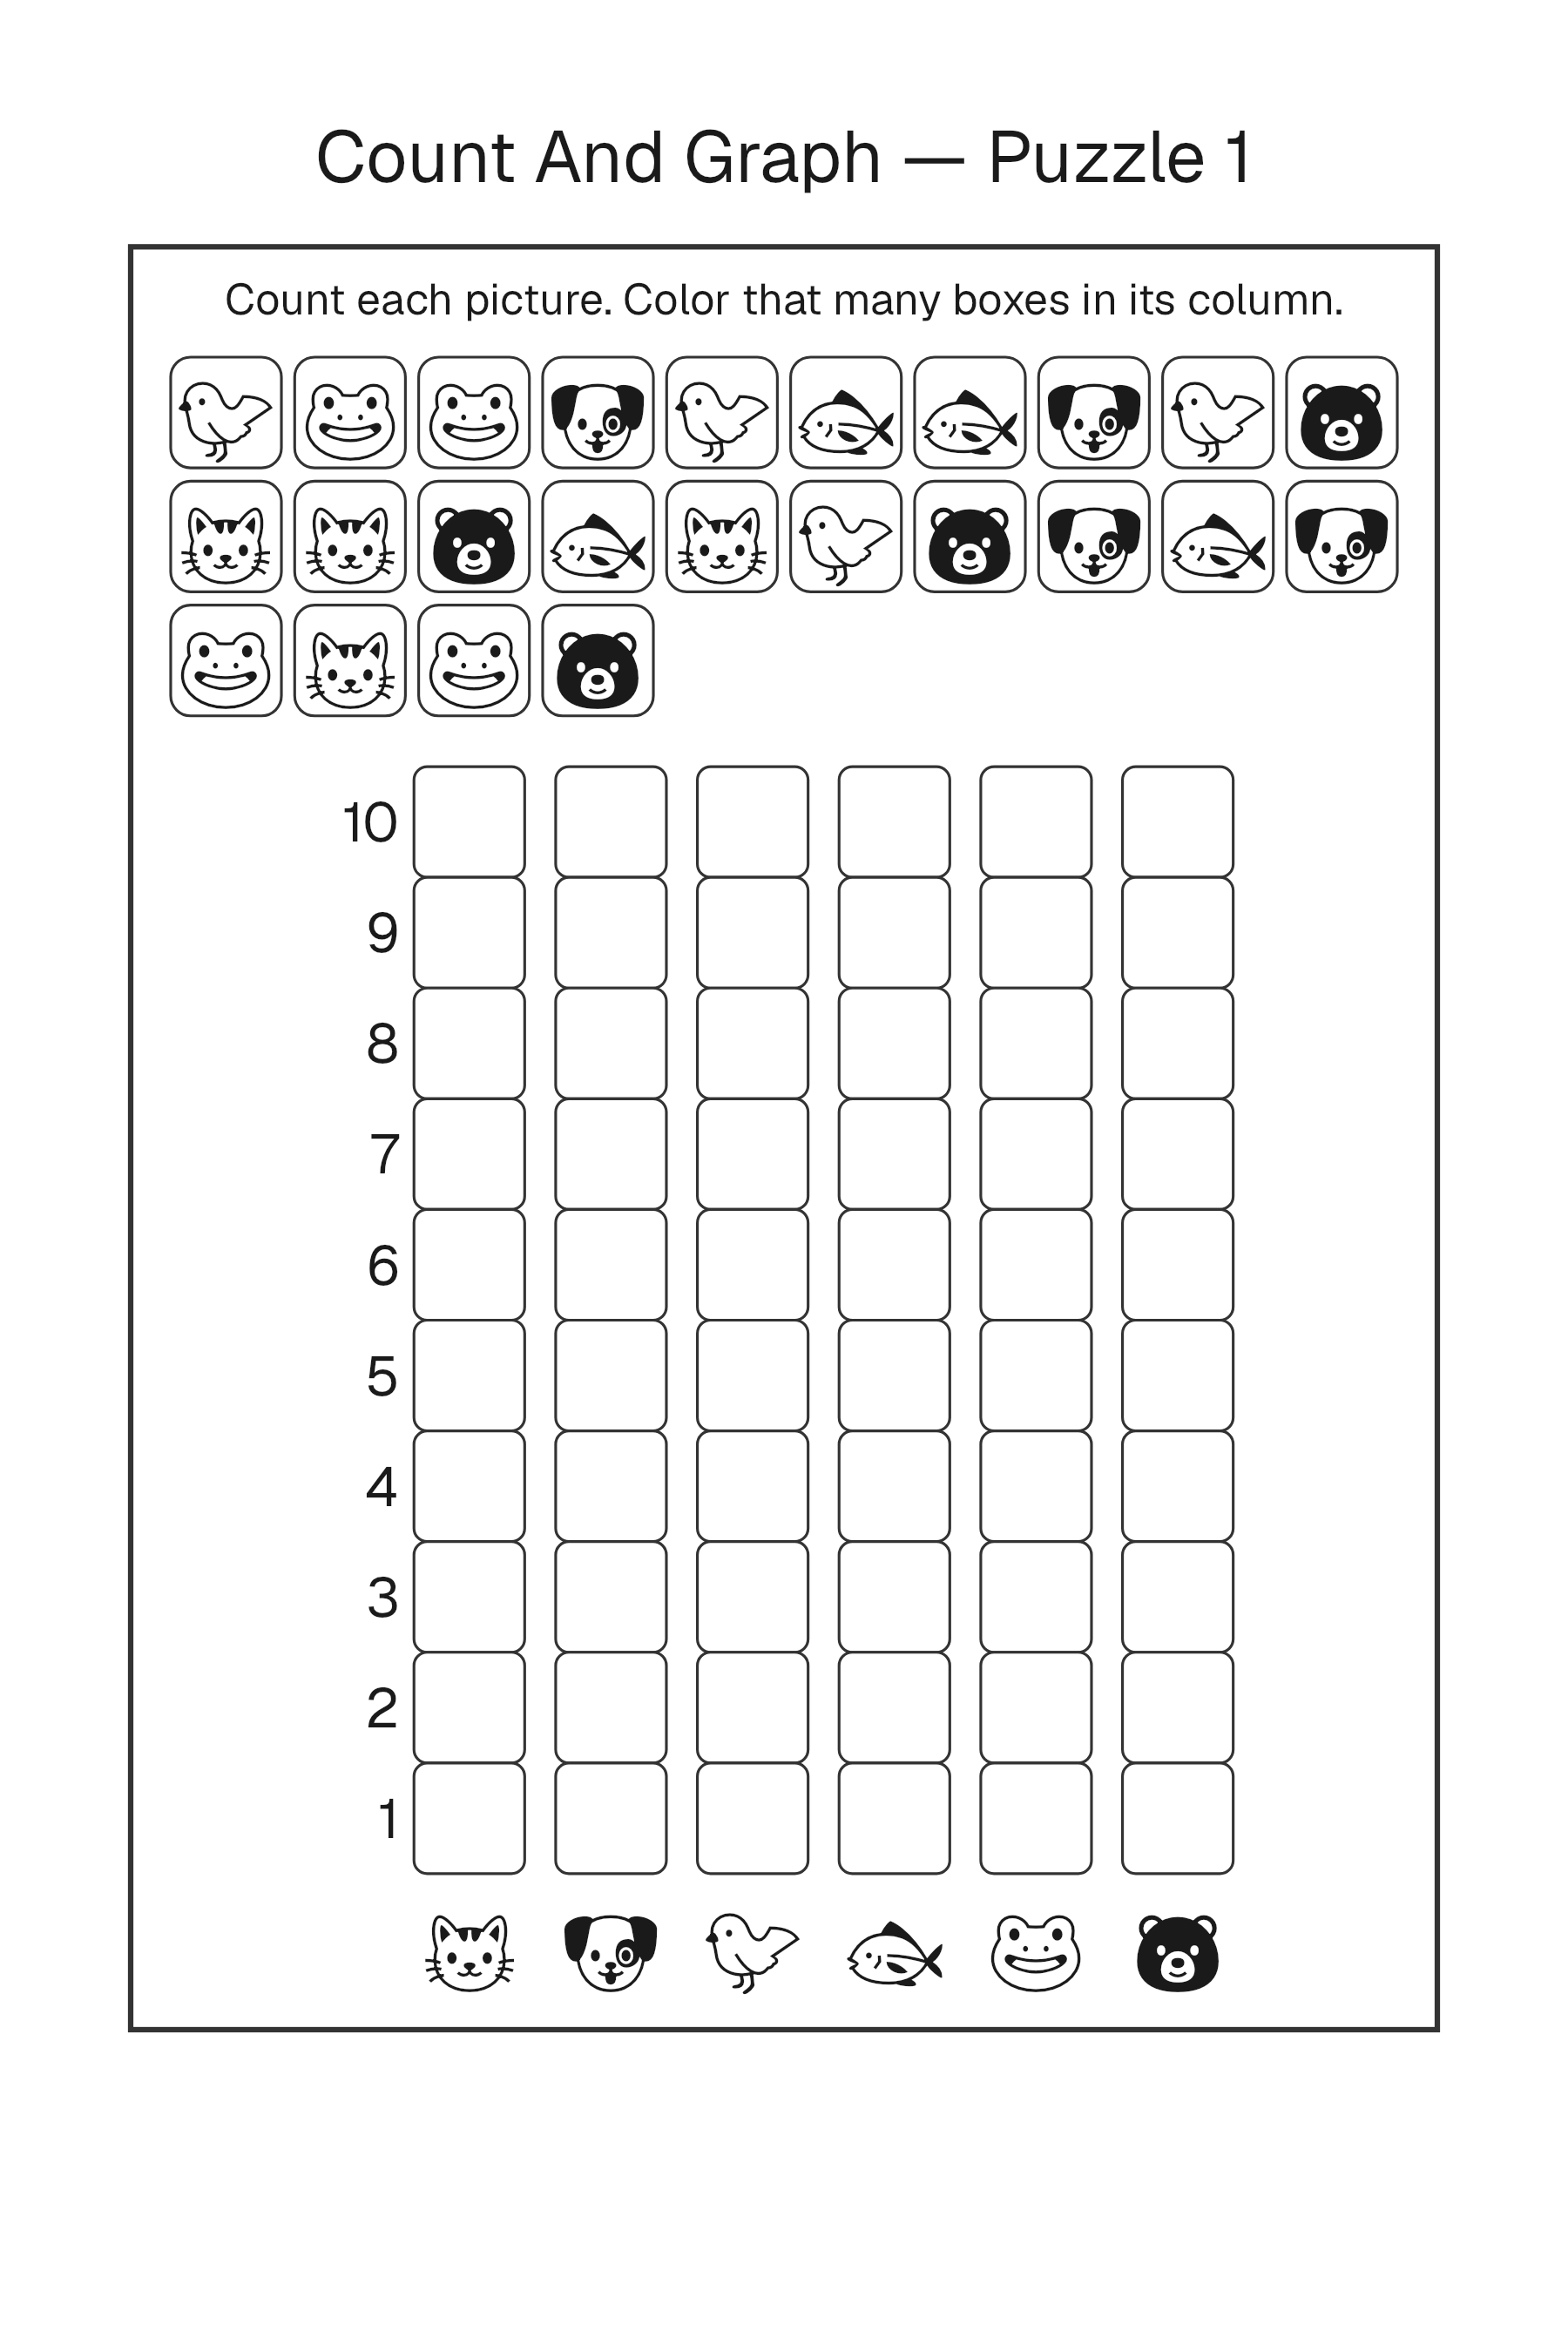
Count and Graph turns a mixed picture strip into a simple bar chart. You tally how many times each animal appears, then color that many boxes in its column. Kindergarten and first-grade counters, homeschool families, and teachers who want a one-page data activity enjoy it.
Solution page included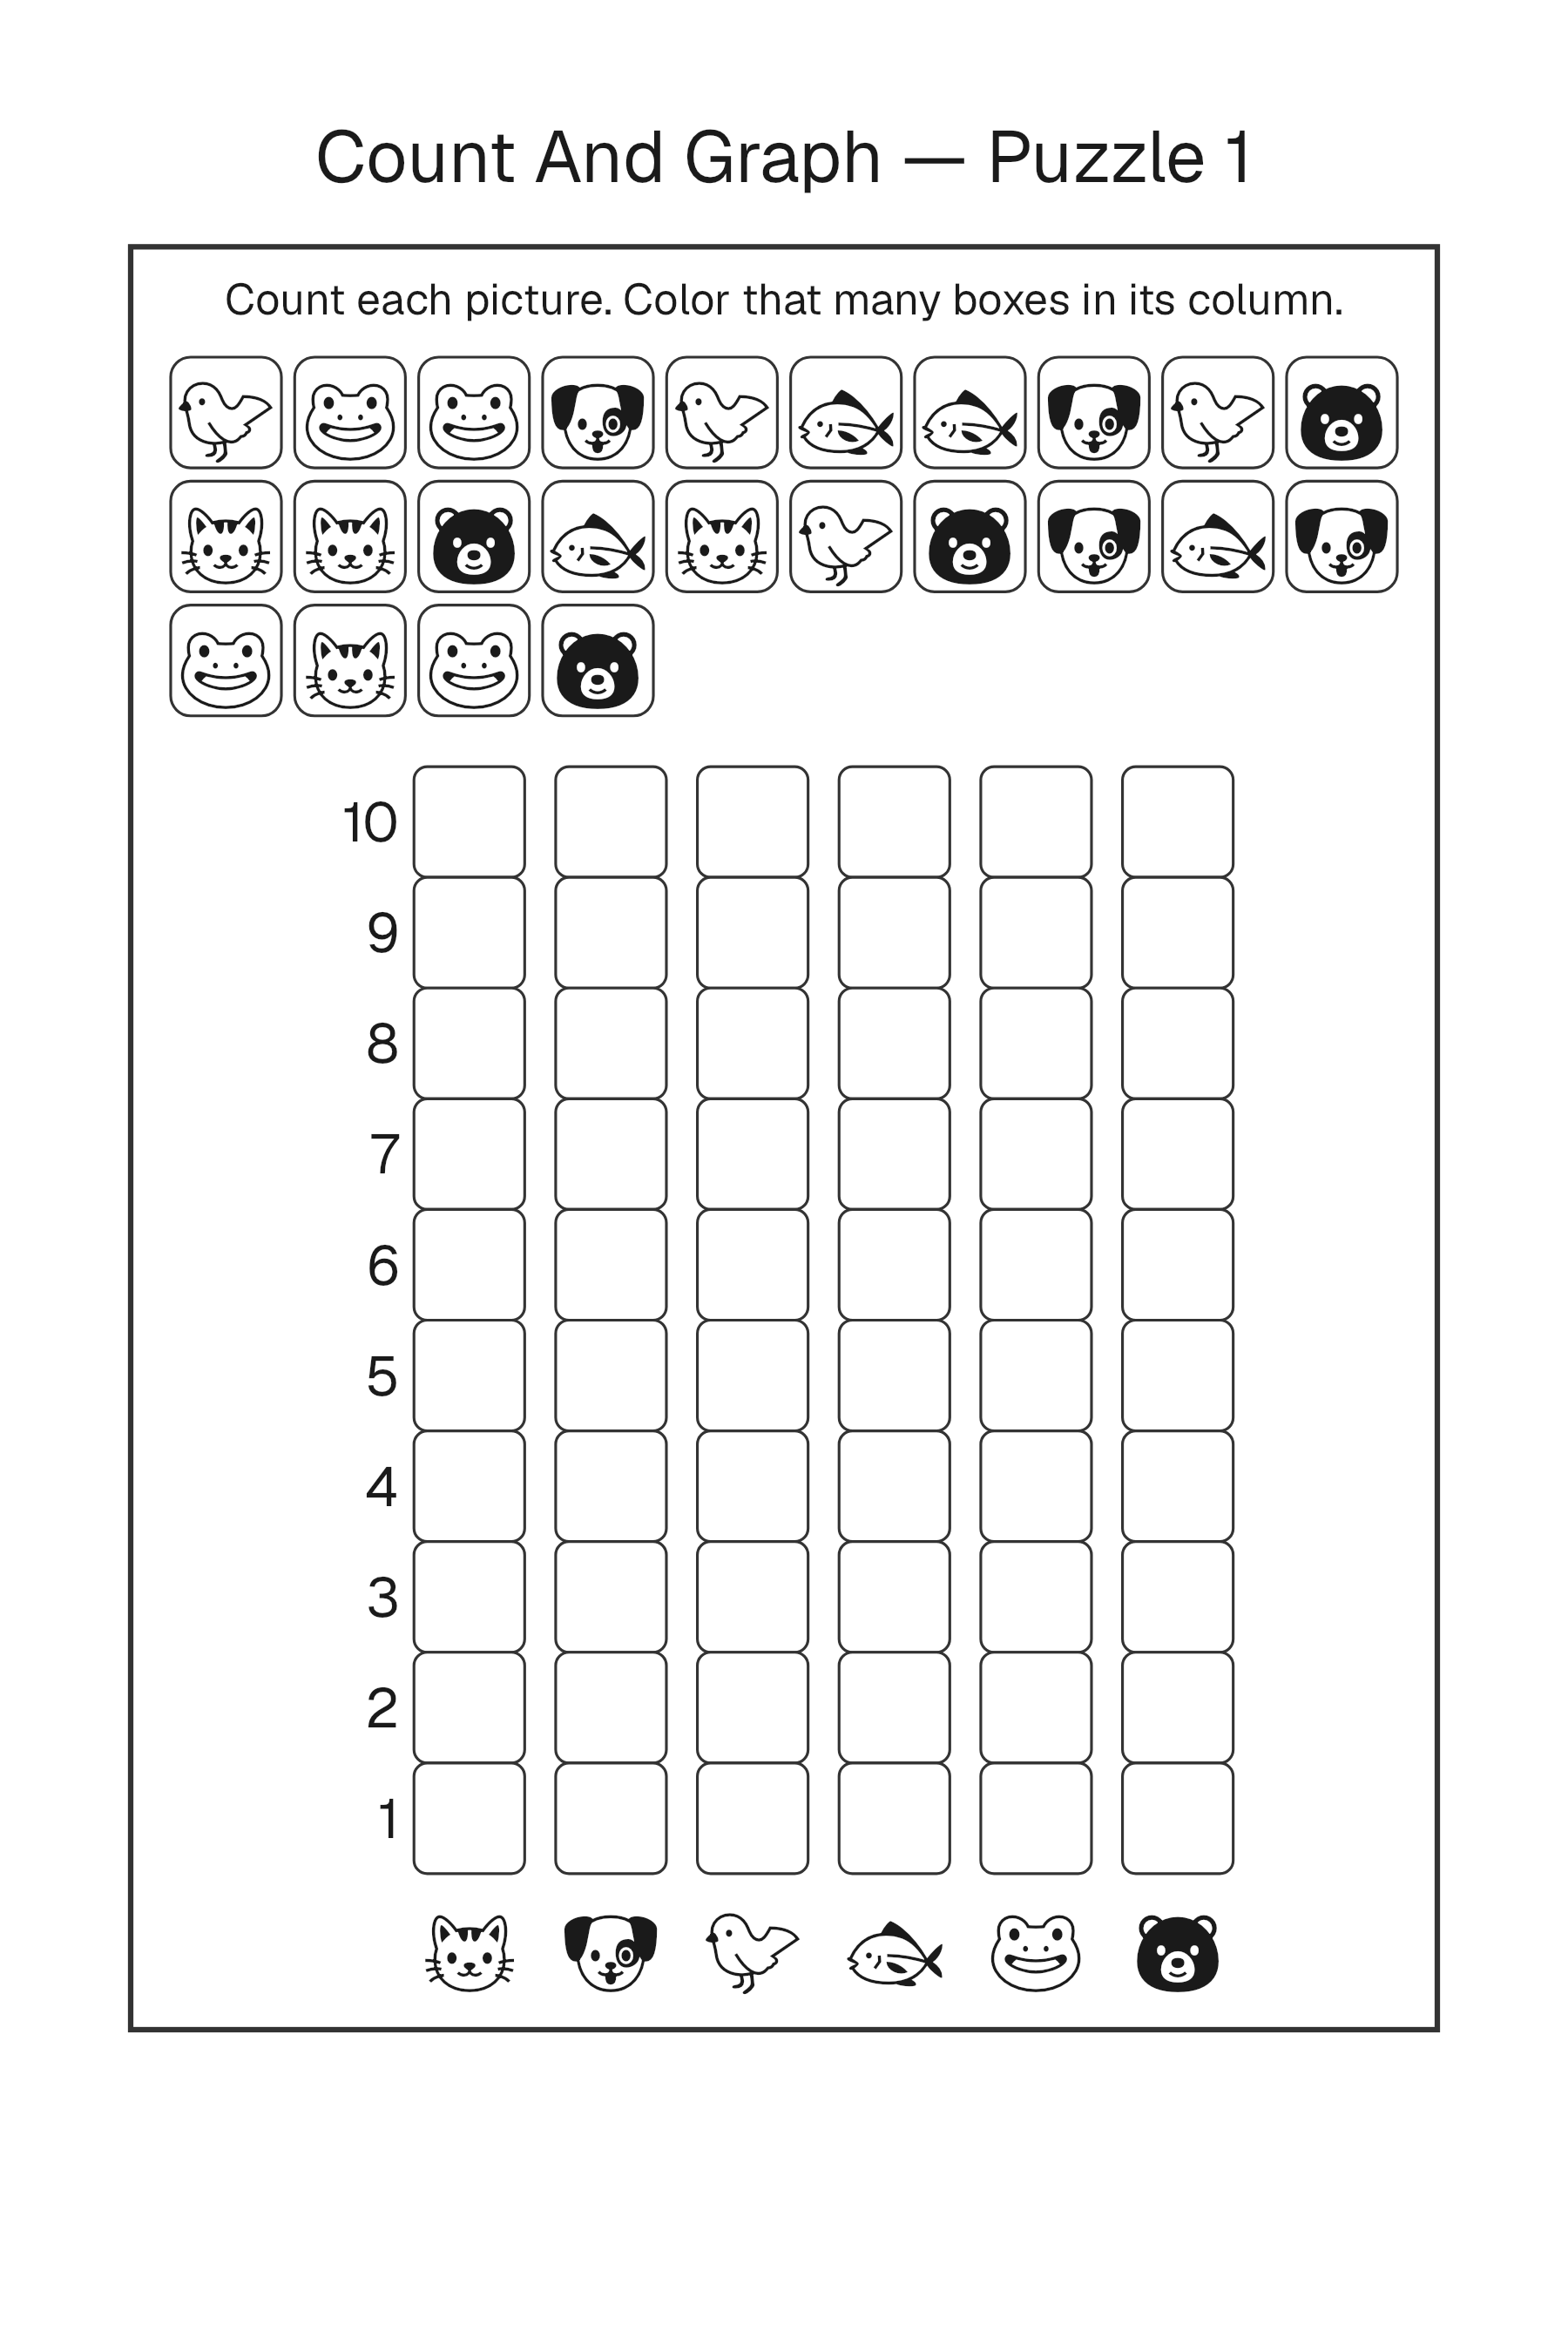
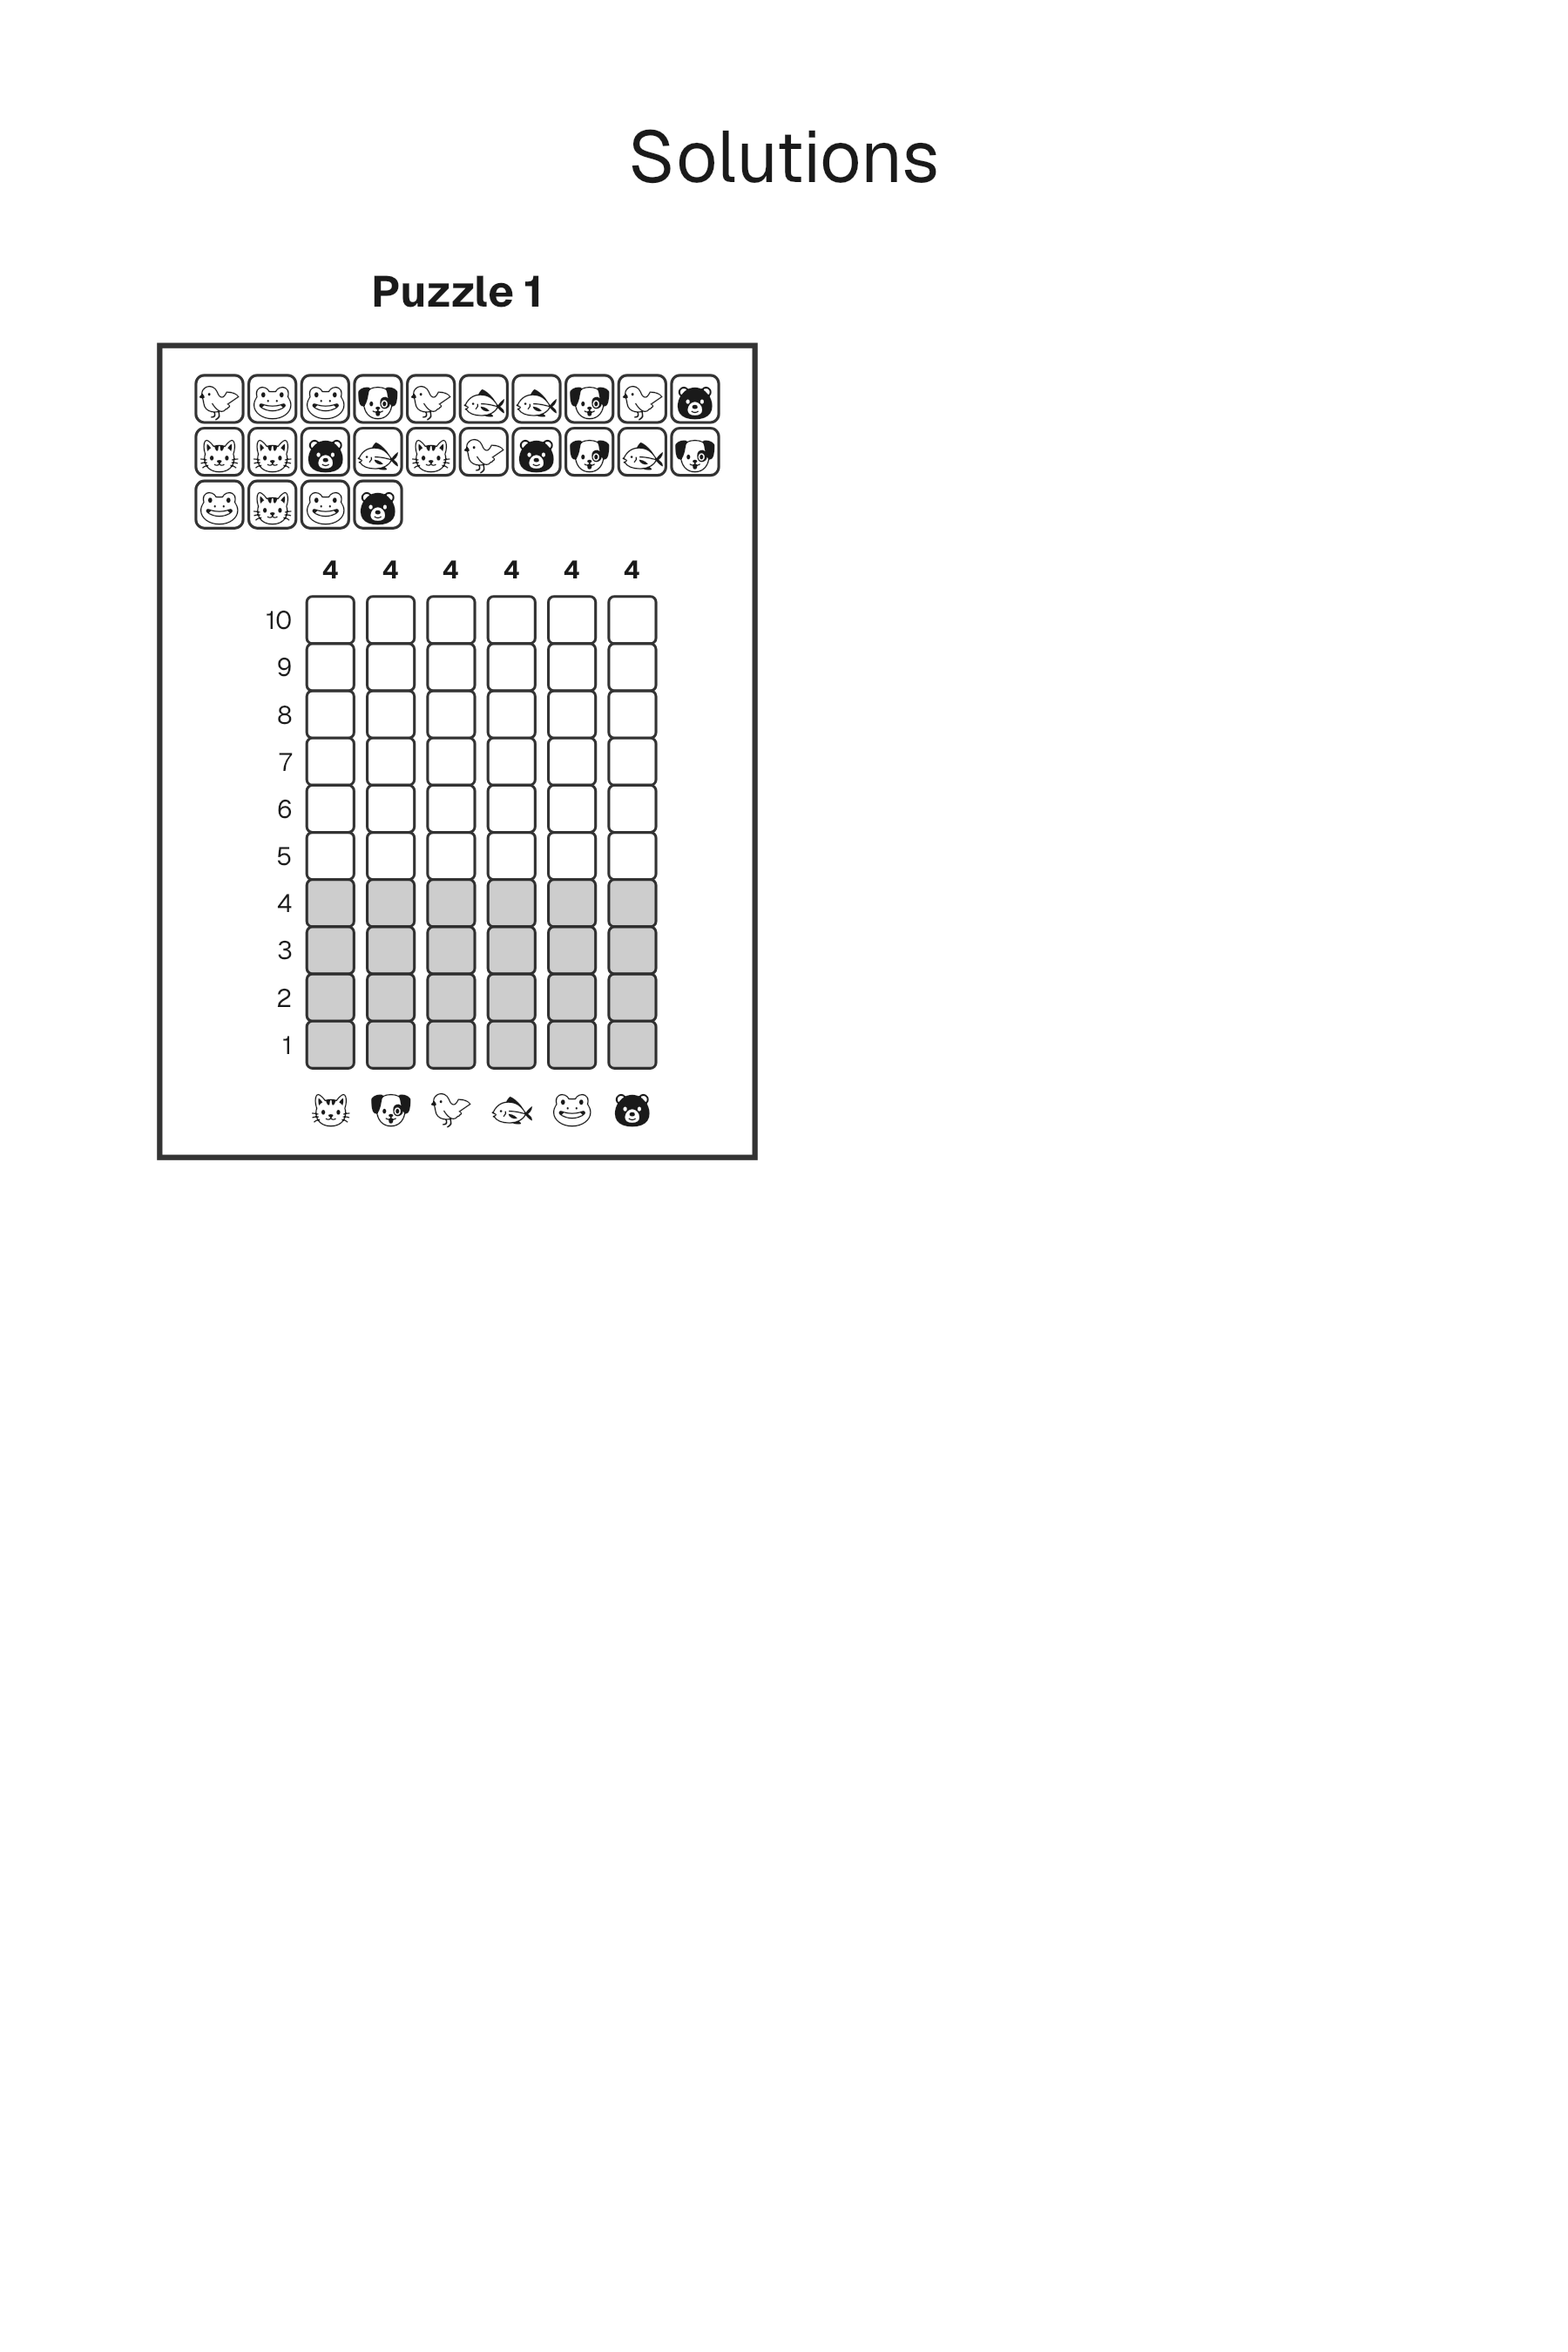
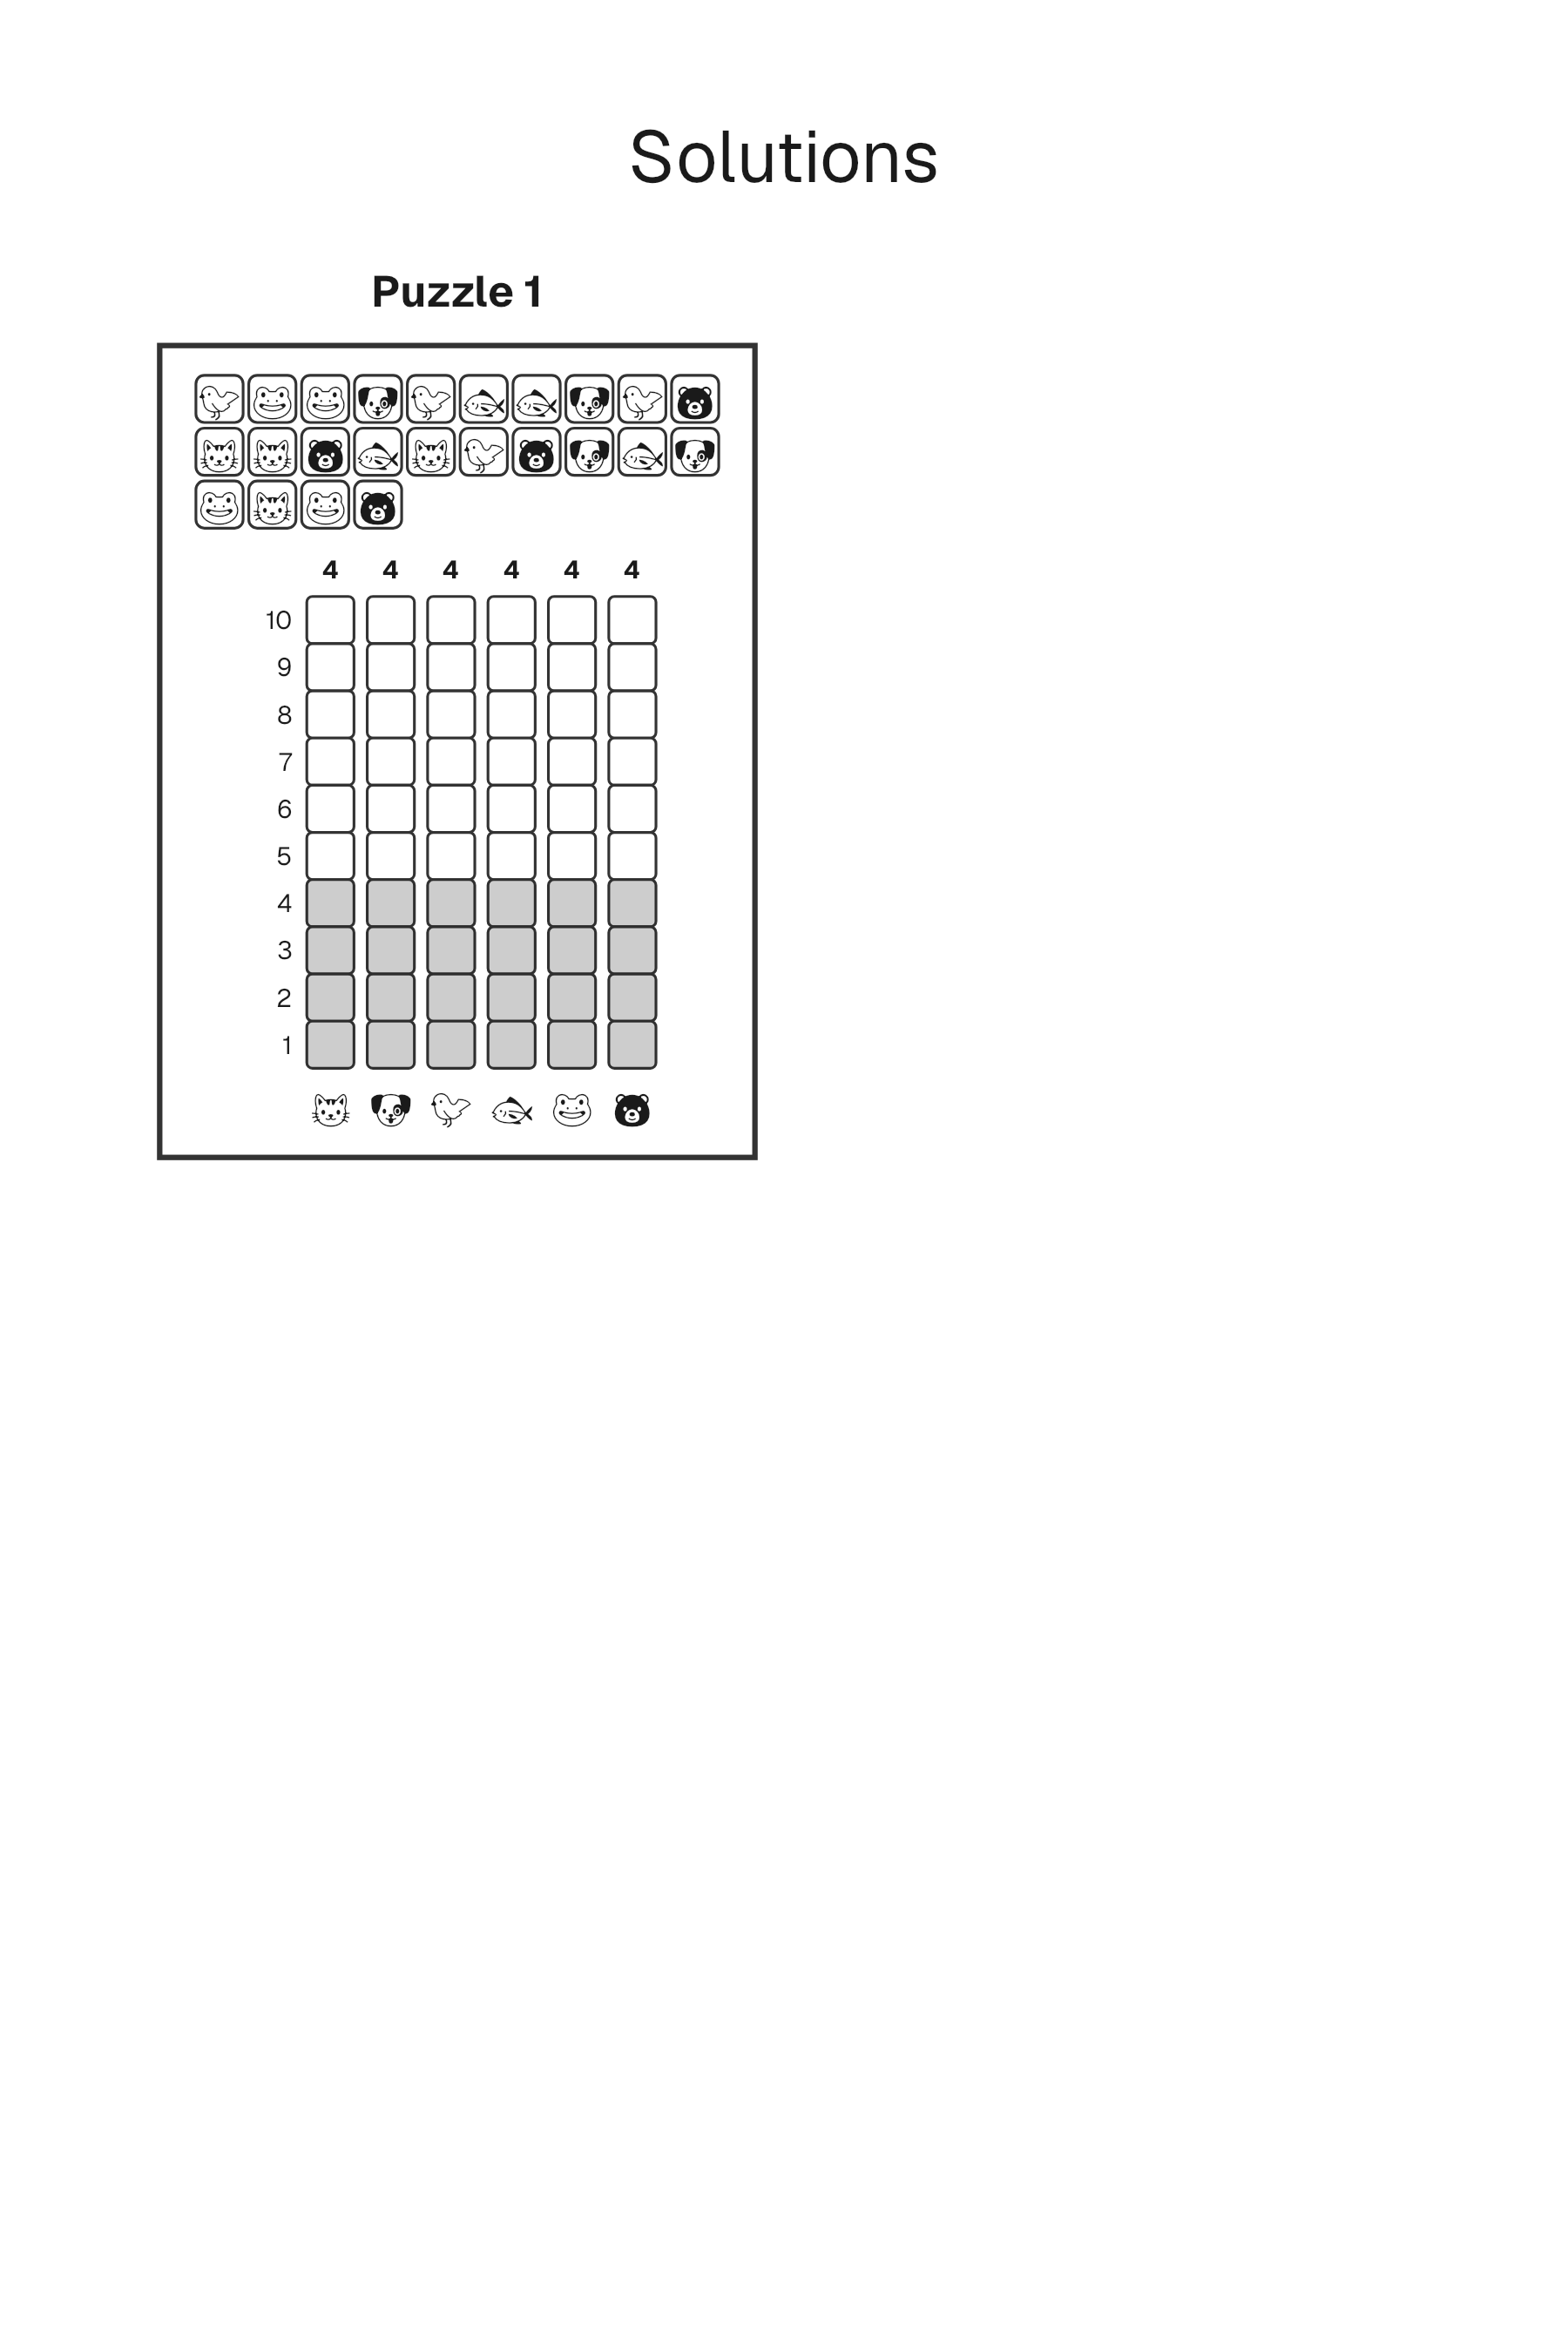
Peek at the solution
The free download is a high-resolution PNG sized for a 6x9 inch page, together with a solution that shows the finished bars. No signup is required.
How to play
- Look at the mixed animal pictures across the top of the page.
- Count how many times each animal appears: cat, dog, bird, fish, frog, and bear.
- Color one box per count in that animal's column, starting from 1 at the bottom and working up toward 10.
- Compare your six bars with the solution page.
Print at 100% scale on letter or A4 paper so the 1-to-10 columns stay large enough to color without smearing neighboring bars.
Frequently asked questions
Where is the Count and Graph solution?
A matching solution image on this page shows how many boxes to color in each of the six columns. Download it with the worksheet if you want an answer key for checking, or keep it separate until the bars are filled. Both files are PNG images.
Is this Count and Graph page free to print?
Yes. You can save the puzzle and the solution at no cost, with no signup. Print them at home or school for a short math center. The download is a pair of images, not a PDF and not an online activity.
Who is this animal bar-chart page for?
It is aimed at early counters who can recognize simple animal icons and fill boxes one-to-one. The chart only goes to 10, so the totals stay in a comfortable range. Teachers often use it as a first graphing lesson: count, then show the count as a bar.
How should I print it so the chart boxes are easy to color?
Print at 100% scale on letter or A4 paper so the 6x9 layout keeps the column boxes large enough for crayons. Fit-to-page can shrink the picture strip until the animals are hard to tell apart. Crayons or markers both work; color from the bottom of each column so the bar reads like a graph.
Get the KDP toolkit updates
New free tools and KDP rate-change alerts, occasionally, no spam.